Every incident recorded. Every trend visible.
Every incident recorded
Every event categorised
Every trend visible
A clear picture, every shift
Daily summaries categorise each incident and the action taken, turning a busy production day into a record the whole team can act on.
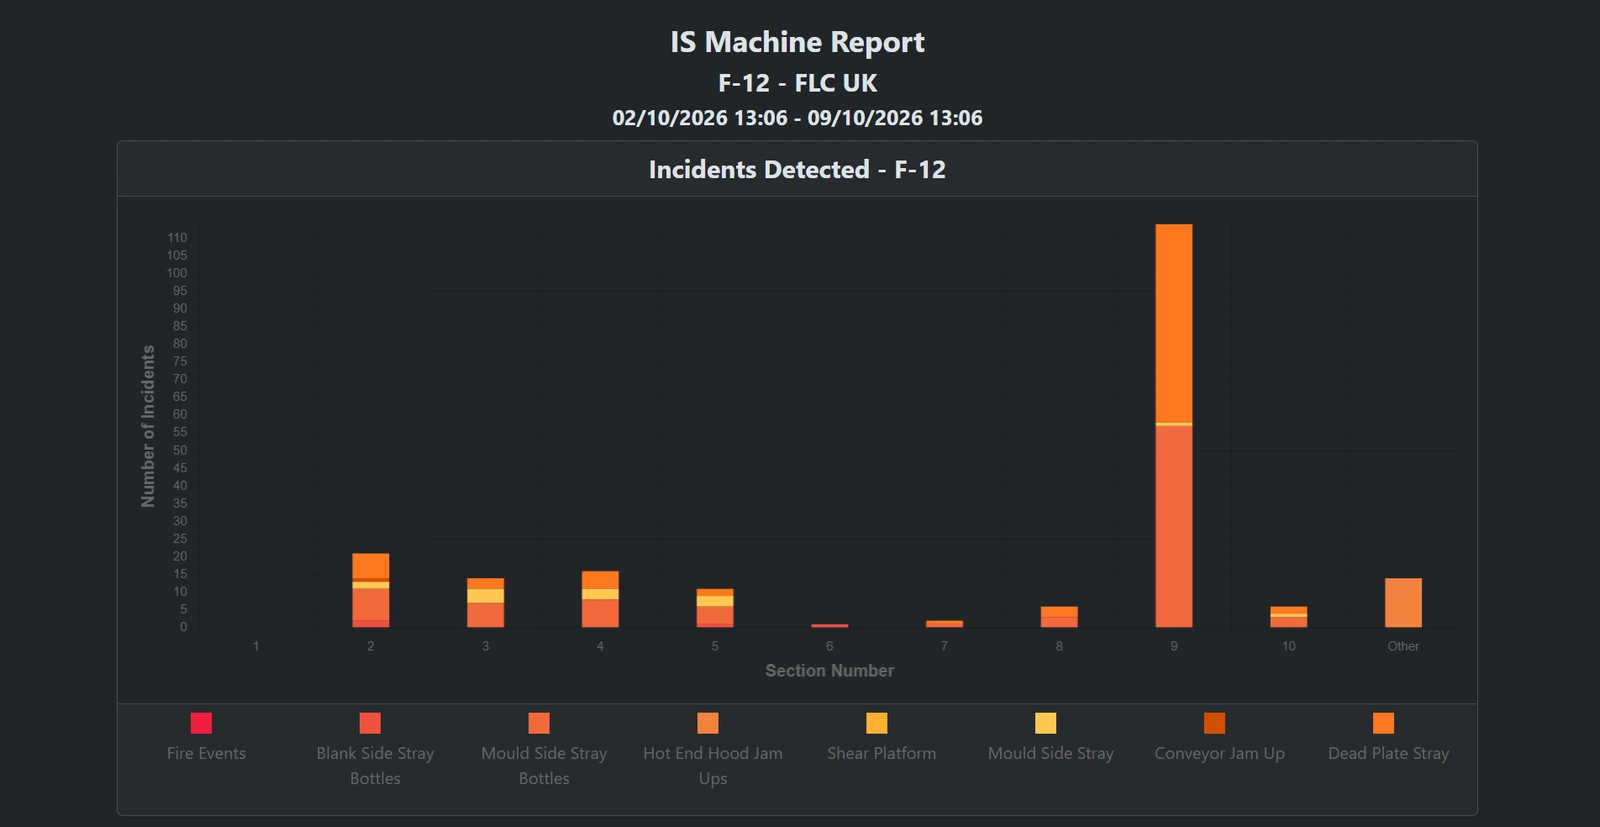
IS Machine Report
Incidents detected, broken down by section and incident type.
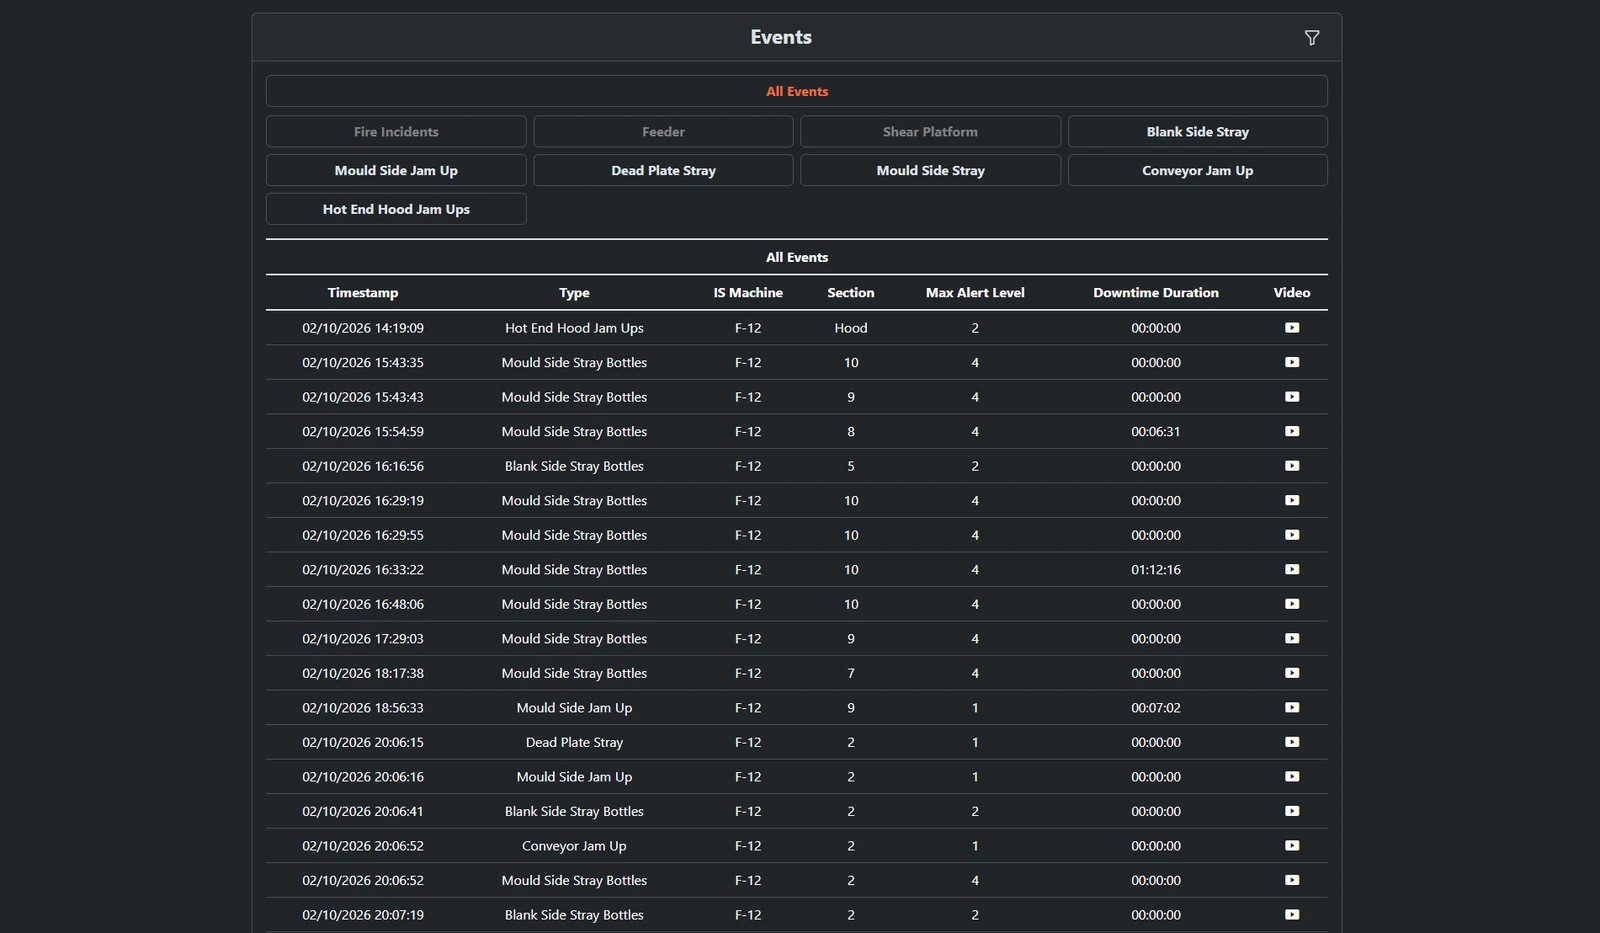
Event Log
Every event logged with timestamp, type, section, alert level and video.
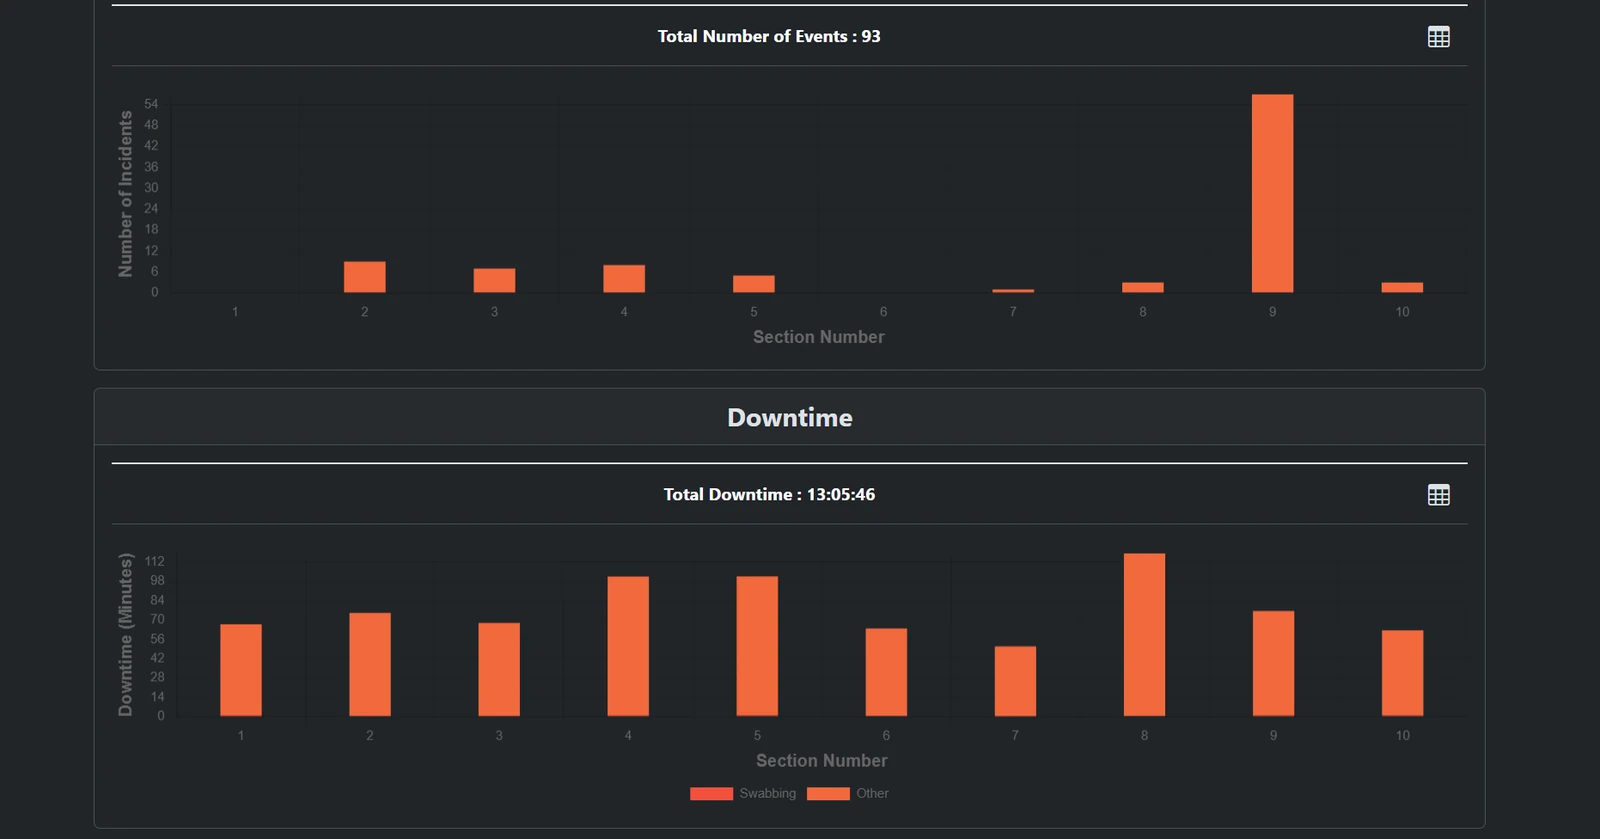
Events & Downtime
Total events and downtime for each section, side by side.
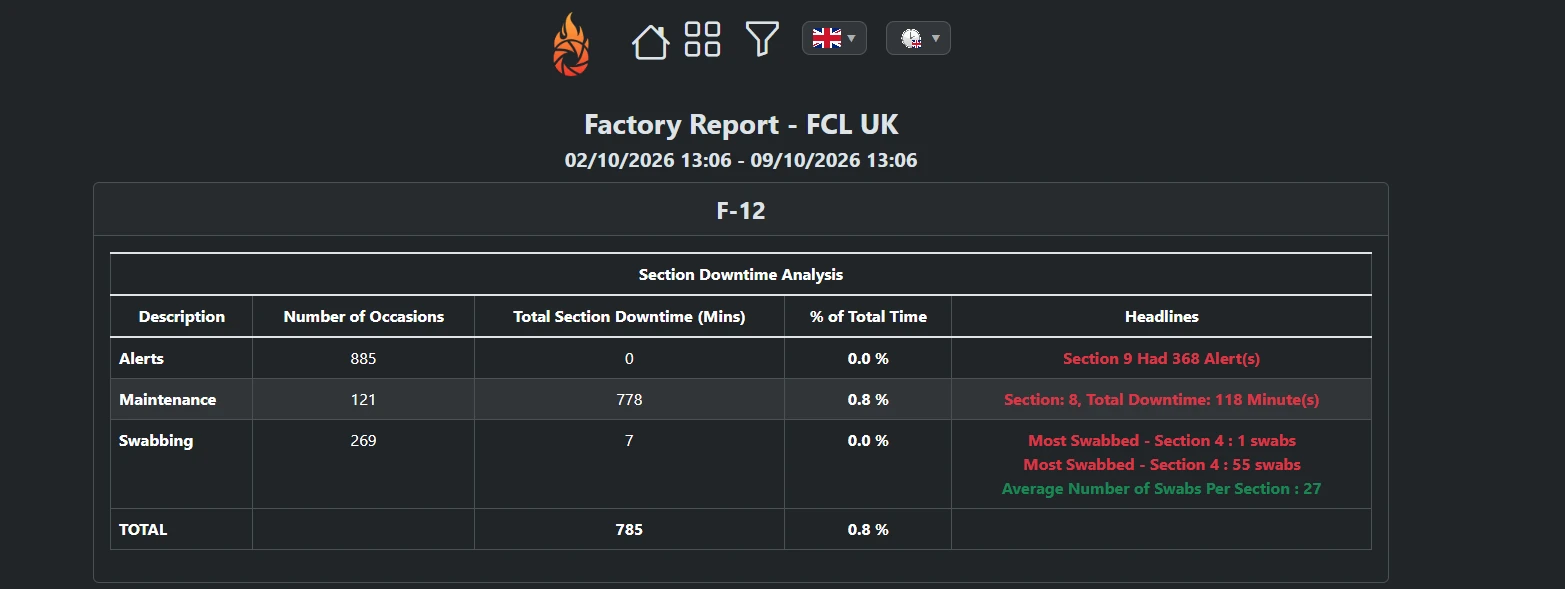
Factory Report
Section downtime analysis across alerts, maintenance and swabbing.
Patterns you can't see in a single shift
Recurring Faults
The faults that keep coming back, ranked so you fix the right thing first.
Machine Comparisons
How each machine performs against the others across the plant.
Section Comparisons
Which sections drive the most incidents, down to the individual position.
Safety data that pays its way
The same data that prevents incidents drives measurable operational gains.
Identifying Repeat Issues
The same fault, the same section, again and again, surfaced automatically instead of lost in shift handovers.
Maintenance Planning
Data-led scheduling that targets the equipment actually generating incidents.
Swabbing Optimisation
Refine swabbing routines against real incident data rather than fixed assumptions.
Production Consistency
Fewer interruptions and a more stable, predictable line.
The right detail for every level
Reporting is tailored to the audience, from the shift floor to the boardroom.
Shift & line teams
What happened this shift: incidents, categories and actions taken.
Production management
Trends across sections and machines, with recurring faults highlighted.
Senior management
The big picture: operational improvement, risk reduction and consistency.